Market Outlook
April 3, 2017
Market Cues
Domestic Indices
Chg (%)
(Pts)
(Close)
Indian markets are likely to open flat tracking the SGX Nifty & Asian markets.
BSE Sensex
(0.1)
(27)
29,621
The Dow Jones Industrial Average declined 0.3%, to finish at 20,663, led lower by
Nifty
0.0
-
9,174
shares of Exxon Mobil Corp. and DuPont. The S&P 500 index closed down 0.2%, at
Mid Cap
0.8
111
14,097
2,363, with financial and telecom stocks weighing on the index.
Small Cap
0.7
103
14,434
The UK markets dropped for a second session on Friday, weighed by declining
Bankex
(0.7)
(180)
24,421
miners on the back of a slump in metals prices and political uncertainty in South
Africa. The FTSE 100 index ended down 0.6% at 7,323, turning 0.2% lower for the
Global Indices
Chg (%)
(Pts)
(Close)
week.
Dow Jones
(0.3)
(65)
20,663
In India, benchmark index Sensex slipped 27 points on Friday to end at 29,621 on
Nasdaq
(0.0)
(3)
5,912
the last trading day of 2016-17, but scored a gain of over 16% for the full fiscal.
FTSE
(0.6)
(47)
7,323
The broader 50-share index Nifty, ended flat at 9,174 points. The Sensex gained
Nikkei
(0.8)
(154)
18,909
16.88%, while the Nifty soared 18.55% in FY17.
Hang Seng
(0.8)
(189)
24,112
News Analysis
Shanghai Com
0.4
12
3,223
CL Educate: IPO update
Indian PV market grows fastest in 7 years
Advances / Declines
BSE
NSE
Detailed analysis on Pg2
Advances
1,621
947
Investor’s Ready Reckoner
Declines
1,142
702
Key Domestic & Global Indicators
Unchanged
225
80
Stock Watch: Latest investment recommendations on 150+ stocks
Refer Pg5 onwards
Volumes (` Cr)
BSE
4,954
Top Picks
CMP
Target
Upside
Company
Sector
Rating
NSE
26,359
(`)
(`)
(%)
Amara Raja Batteries Auto & Auto AncillaryAccumulate
889
1,009
13.5
HCL Tech
IT
Accumulate
873
1,000
14.5
Net Inflows (` Cr)
Net
Mtd
Ytd
Power Grid Corp.
Power
Accumulate
197
223
13.1
FII
443
30,292
40,731
Navkar Corp.
Others
Buy
177
265
50.0
MFs
1,860
2,368
9,438
KEI Industries
Others
Accumulate
183
207
13.3
More Top Picks on Pg3
Top Gainers
Price (`)
Chg (%)
Key Upcoming Events
Rtnpower
8
7.1
Previous
Consensus
Date
Region
Event Description
Indianb
280
6.0
Reading
Expectations
Apr 03, 2017 Germany PMI Manufacturing
58.30
58.30
Southbank
21
5.4
Apr 03, 2017 UK
PMI Manufacturing
54.60
55.00
Kec
208
5.3
Apr 05, 2017 US
Initial Jobless claims
258.00
250.00
Get&D
331
5.0
Apr 06, 2017 Germany PMI Services
55.60
55.60
Apr 06, 2017 India
RBI Reverse Repo rate
5.75
5.75
Top Losers
Price (`)
Chg (%)
Apr 06, 2017 UK
Industrial Production (YoY)
3.20
3.70
More Events on Pg4
Sobha
342
(3.2)
Dishman
290
(3.1)
Justdial
528
(2.9)
Bajajelec
313
(2.4)
Gppl
165
(2.2)
As on March 31, 2017
Market Outlook
April 3, 2017
News Analysis
CL Educate: IPO update
CL Educate made a weak debut on the bourses with the stock declining by 17% at
closing on the listing day. The stock declined to as low as `398 but recovered to
`417 by end of day making a weak debut. At `417, the stock trades at 19.3x of
annualized 1HFY17 earnings which we believe is expensive to its peers like MT
Educare. While the valuation still looks expensive, its ROE profile of CLEL does not
appear to be attractive.
Indian PV market grows fastest in 7 years
Indian PV manufacturers have seen the fastest pace of expansion in seven years,
i.e. more than 9% in FY17. The momentum is expected gain strength in FY18 too
with lower interest rates and strong consumption trends.
While demonetisaiton, impacted the consumer sentiment for short term, with
remonetisation , the sentiment is back. This can also been seen by the success of
the automakers in clearing off their BS-III inventory by end of March-2017. The
government is investing heavily in infrastructure and economic activity is showing
pick-up which bodes well for growth of the automobile sector.
Maruti Suzuki reported its March sales rose by 8.1% to 1,39,763 units while Tata
Motors’ March sales grew by 8% at 57,145 units.
Economic and Political News
Indian economy expected to grow at 7.2 per cent in 2017, 7.7 per cent in
2018: Arun Jaitley
Special funds may help Centre meet PSUs' holding cap
China's Manufacturing Sector Growth Eases Slightly
Japan Manufacturing PMI Slips To 52.4 In March - Nikkei
Corporate News
NR Narayana Murthy slams Infosys COO pay hike
Extension of Reliance Jio sops may shave off rivals’ earnings
Indian passenger vehicle market scales new peak of 3 million, grows fastest in
7 years
CIL eyes supply contracts with power plants to increase sales
Market Outlook
April 3, 2017
Top Picks ★★★★★
Large Cap
Market Cap
CMP
Target
Upside
Company
Rationale
(` Cr)
(`)
(`)
(%)
To outpace battery industry growth due to better technological
Amara Raja Batteries
15,185
889
1,009
13.5
products leading to market share gains in both the
automotive OEM and replacement segments.
The stock is trading at attractive valuations and is factoring all
HCL Tech
1,23,207
873
1,000
14.5
the bad news.
Back on the growth trend, expect a long term growth of 14%
Infosys
2,34,472
1,021
1,249
22.3
to be a US$20bn in FY2020.
Strong order backlog and improvement in execution would
Larsen & Tourbo
1,47,185
1,578
1,700
7.8
trigger the growth for the L&T.
One of the largest pharma companies with strong
Lupin
65,244
1,445
1,809
25.2
international presence. It has a rich pipeline of ANDAs which
is also one of the largest among the generic companies.
Going forward, we expect the company to report strong top-
Power Grid Corporation
1,03,167
197
223
13.1
line CAGR of ~16% and bottom-line CAGR of ~19% over
FY16-18 on back of strong capitalization guidance
Source: Company, AngelResearch
Mid Cap
Market Cap
CMP
Target
Upside
Company
Rationale
(` Cr)
(`)
(`)
(%)
We expect the company would report strong profitability
Asian Granito
1,108
368
390
5.9
owing to better product mix, higher B2C sales and
amalgamation synergy.
Among the top 4 players in the consumer durables segment.
Bajaj Electricals
3,168
313
330
5.5
Improved profitability backed by turn around in E&P segment.
Strong order book lends earnings visibility.
Favourable outlook for the AC industry to augur well for
Cooling products business which is out pacing the market
Blue Star
6,621
693
740
6.8
growth. EMPPAC division's profitability to improve once
operating environment turns around.
Strong loan growth backed by diversified loan portfolio and
Equitas Holdings
5,724
170
235
38.6
adequate CAR. ROE & ROA likely to remain decent as risk of
dilution remains low. Attractive valuations considering growth.
Economic recovery to have favourable impact on advertising
& circulation revenue growth. Further, the acquisition of a
Jagran Prakashan
6,247
191
225
17.7
radio business (Radio City) would also boost the company's
revenue growth.
High order book execution in EPC segment, rising B2C sales
KEI Industries
1,421
183
207
13.3
and higher exports to boost the revenues and profitability
Speedier execution and speedier sales, strong revenue visibilty
Mahindra Lifespace
1,589
387
522
34.9
in short-to-long run, attractive valuations
Higher growth in domestic branded sales and healthy export
Mirza International
1,035
86
107
24.4
to boost the profitability.
Massive capacity expansion along with rail advantage at ICD
Navkar Corporation
2,519
177
265
50.0
as well CFS augurs well for the company
Strong brands and distribution network would boost growth
Siyaram Silk Mills
1,592
1,698
1,872
10.3
going ahead. Stock currently trades at an inexpensive
valuation.
Market leadership in Hindi news genre and no. 2 viewership
ranking in English news genre, exit from the radio business,
TV Today Network
1,538
258
344
33.4
and anticipated growth in ad spends by corporates to benefit
the stock.
Source: Company, Angel Research
Market Outlook
April 3, 2017
Key Upcoming Events
Global economic events release calendar
Bloomberg Data
Date
Time
Country
Event Description
Unit
Period
Last Reported
Estimated
Apr 03, 2017
1:25 PM Germany
PMI Manufacturing
Value
Mar F
58.30
58.30
2:00 PM UK
PMI Manufacturing
Value
Mar
54.60
55.00
Apr 05, 2017
6:00 PM US
Initial Jobless claims
Thousands
Apr 1
258.00
250.00
Apr 06, 2017
1:25 PM Germany
PMI Services
Value
Mar F
55.60
55.60
2:30 PM India
RBI Reverse Repo rate
%
Apr 6
5.75
5.75
2:00 PM UK
Industrial Production (YoY)
% Change
Feb
3.20
3.70
2:30 PM India
RBI Repo rate
%
Apr 6
6.25
6.25
Apr 07, 2017
2:30 PM India
RBI Cash Reserve ratio
%
Apr 6
4.00
4.00
6:00 PM US
Change in Nonfarm payrolls
Thousands
Mar
235.00
175.00
6:00 PM US
Unemployment rate
%
Mar
4.70
4.70
Apr 10, 2017
India
Imports YoY%
% Change
Mar
21.76
India
Exports YoY%
% Change
Mar
17.48
Apr 11, 2017
2:00 PM UK
CPI (YoY)
% Change
Mar
2.30
Apr 12, 2017
2:00 PM UK
Jobless claims change
% Change
Mar
-11.30
5:30 PM India
Industrial Production YoY
% Change
Feb
2.70
7:00 AM China
Consumer Price Index (YoY)
% Change
Mar
0.80
1.00
April 13, 2017
US
Producer Price Index (mom)
% Change
Mar
0.10
6:00 PM US
Consumer price index (mom)
% Change
Mar
0.10
-0.10
Apr 14, 2017
China
Exports YoY%
% Change
Mar
-1.30
3.20
Apr 17, 2017
12:00 PM India
Monthly Wholesale Prices YoY%
% Change
Mar
6.55
7:30 AM China
Industrial Production (YoY)
% Change
Mar
6.00
7:30 AM China
Real GDP (YoY)
% Change
1Q
6.80
Apr 18, 2017
6:00 PM US
Housing Starts
Thousands
Mar
1,288.00
1275.00
6:00 PM US
Building permits
Thousands
Mar
1,216.00
1260.00
6:45 PM US
Industrial Production
%
Mar
0.11
0.45
Source: Bloomberg, Angel Research
Market Outlook
April 3, 2017
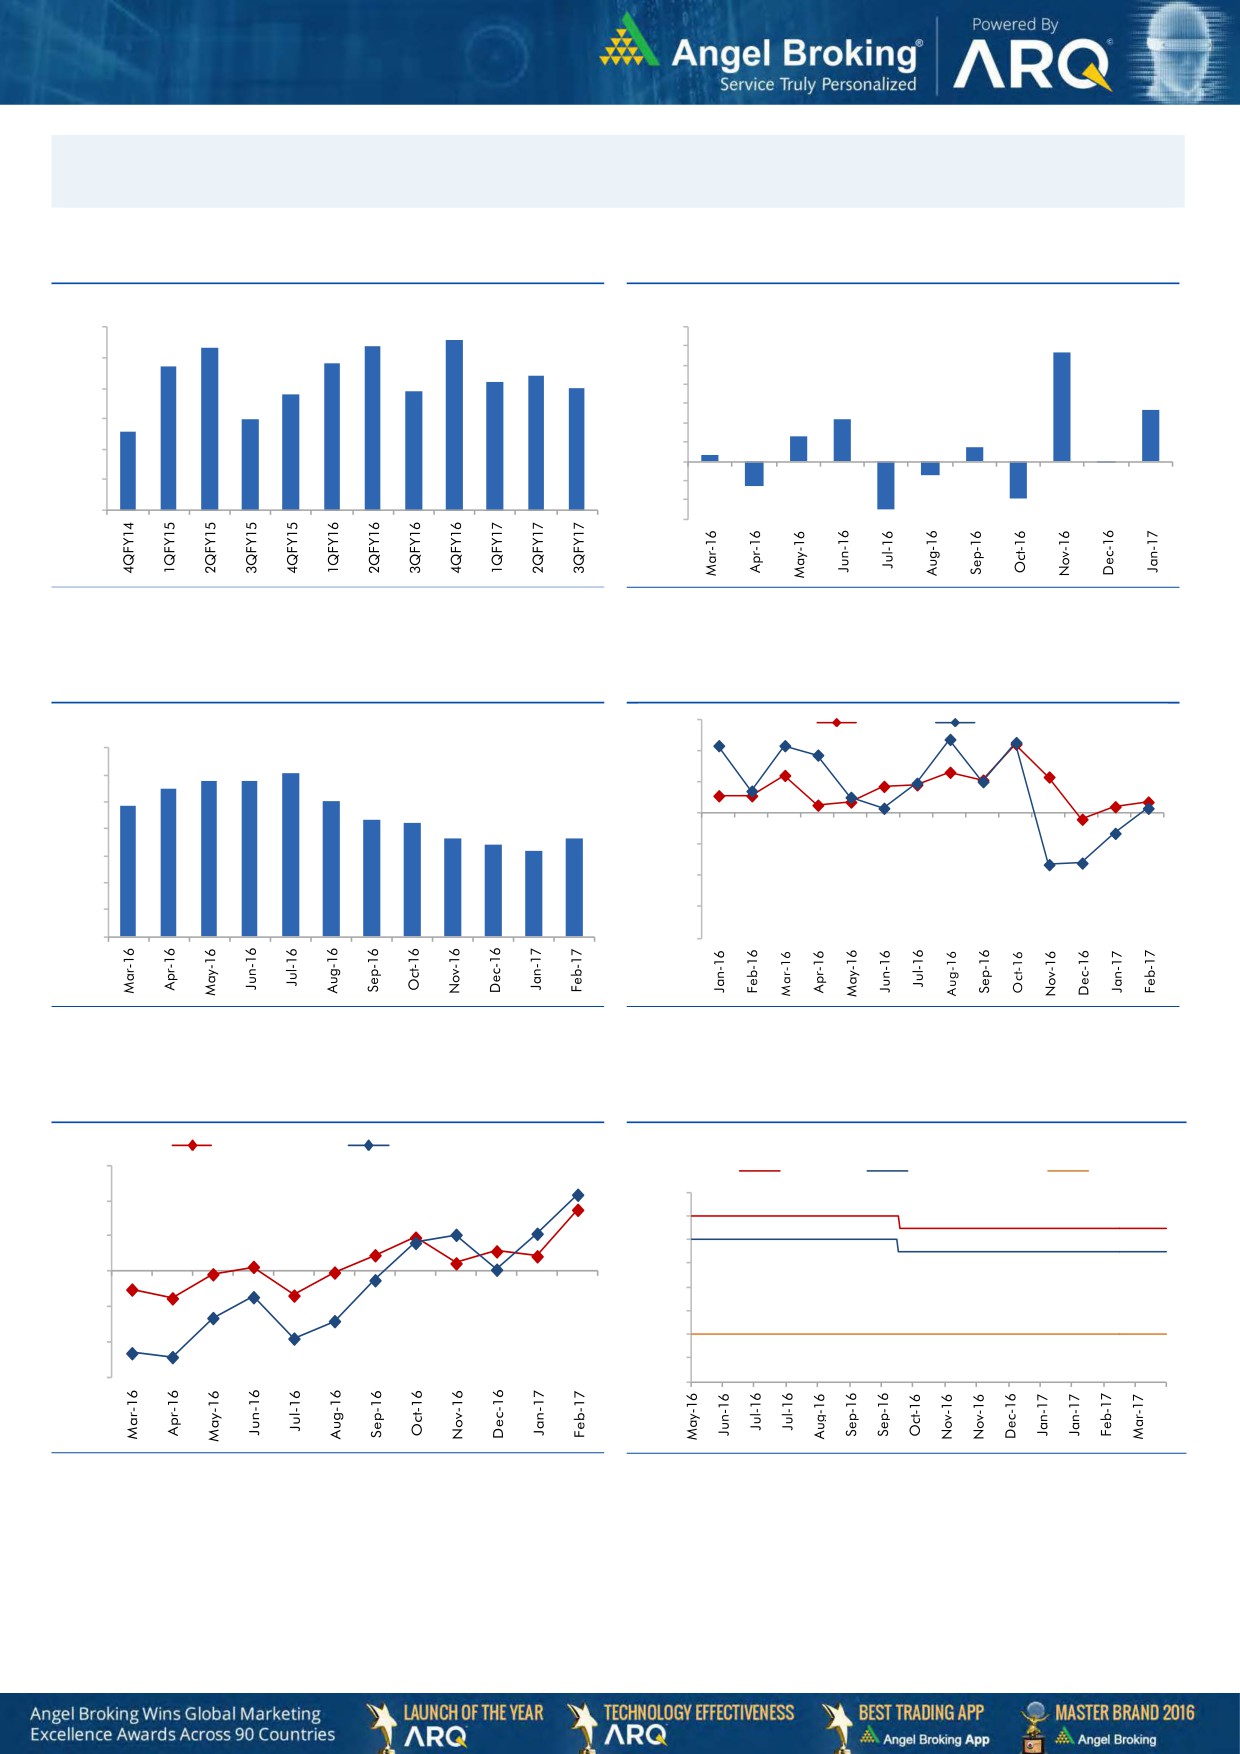
Macro watch
Exhibit 1: Quarterly GDP trends
Exhibit 2: IIP trends
(%)
(%)
8.6
9.0
8.4
7.0
8.3
5.7
7.7
7.8
6.0
8.0
7.4
7.2
5.0
6.9
7.0
6.8
7.0
4.0
2.7
6.0
3.0
2.2
6.0
5.6
1.3
2.0
0.7
1.0
0.3
5.0
-
4.0
(1.0)
(0.1)
(0.7)
(2.0)
3.0
(1.3)
(3.0)
(1.9)
(2.5)
Source: CSO, Angel Research
Source: MOSPI, Angel Research
Exhibit 3: Monthly CPI inflation trends
Exhibit 4: Manufacturing and services PMI
56.0
Mfg. PMI
Services PMI
(%)
7.0
54.0
6.1
5.8
5.8
6.0
5.5
5.1
52.0
4.8
5.0
4.3
4.2
50.0
3.6
3.7
4.0
3.4
3.2
48.0
3.0
46.0
2.0
1.0
44.0
-
42.0
Source: MOSPI, Angel Research
Source: Market, Angel Research; Note: Level above 50 indicates expansion
Exhibit 5: Exports and imports growth trends
Exhibit 6: Key policy rates
(%)
Exports yoy growth
Imports yoy growth
D
30.0
(%)
Repo rate
Reverse Repo rate
CRR
7.00
20.0
6.50
10.0
6.00
5.50
0.0
5.00
(10.0)
4.50
4.00
(20.0)
3.50
(30.0)
3.00
Source: Bloomberg, Angel Research
Source: RBI, Angel Research
Market Outlook
April 3, 2017
Global watch
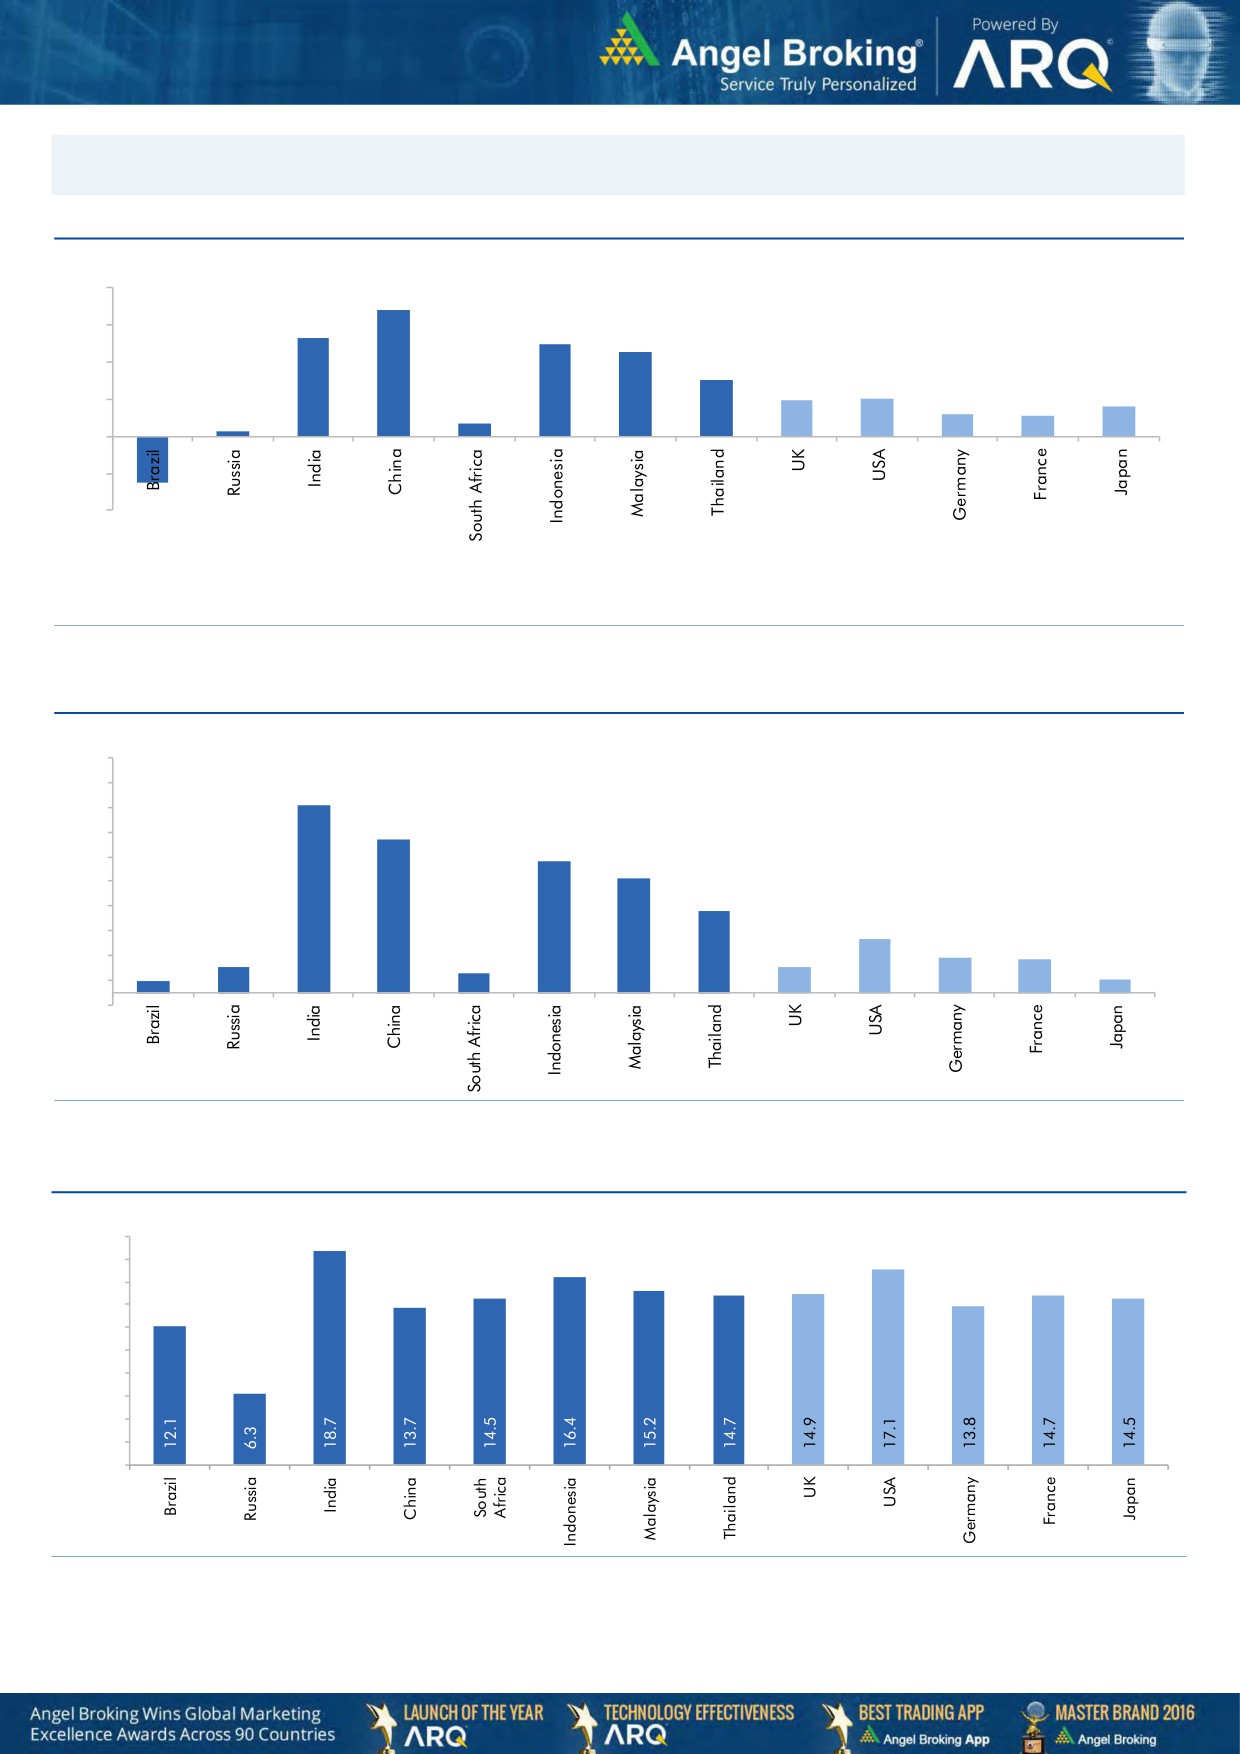
Exhibit 1: Latest quarterly GDP Growth (%, yoy) across select developing and developed countries
(%)
8.0
6.8
0.7
5.3
6.0
4.9
4.5
4.0
3.0
0.3
1.9
2.0
1.2
1.6
1.1
2.0
-
(2.0)
(2.5)
(4.0)
Source: Bloomberg, Angel Research
Exhibit 2: 2017 GDP Growth projection by IMF (%, yoy) across select developing and developed countries
(%)
9.5
8.5
7.6
7.5
6.2
6.5
5.3
5.5
4.6
4.5
3.3
3.5
2.2
2.5
1.1
1.4
1.3
1.1
1.5
0.5
0.8
0.6
0.5
(0.5)
Source: IMF, Angel Research
Exhibit 3: One year forward P-E ratio across select developing and developed countries
(x)
20.0
18.0
16.0
14.0
12.0
10.0
8.0
6.0
4.0
2.0
-
Source: IMF, Angel Research
Market Outlook
April 3, 2017
Exhibit 4: Relative performance of indices across globe
Returns (%)
Country
Name of index
Closing price
1M
3M
1YR
Brazil
Bovespa
64,984
(3.0)
10.7
29.8
Russia
Micex
1,996
(2.0)
(8.6)
6.9
India
Nifty
9,174
3.3
14.2
20.5
China
Shanghai Composite
3,223
(0.8)
3.6
7.4
South Africa
Top 40
45,167
2.3
2.7
(2.1)
Mexico
Mexbol
48,542
3.6
5.7
7.2
Indonesia
LQ45
922
3.2
6.2
9.9
Malaysia
KLCI
1,740
2.5
7.4
2.1
Thailand
SET 50
996
1.1
4.7
10.9
USA
Dow Jones
20,663
(2.1)
4.2
16.5
UK
FTSE
7,323
(0.8)
2.5
18.8
Japan
Nikkei
18,909
(1.1)
(2.5)
11.2
Germany
DAX
12,313
2.0
6.2
27.2
France
CAC
5,123
3.3
4.9
14.1
Source: Bloomberg, Angel Research
Stock Watch
April 03, 2017
Company Name
Reco
CMP
Target
Mkt Cap
Sales ( Čcr )
OPM(%)
EPS (Č)
PER(x)
P/BV(x)
RoE(%)
EV/Sales(x)
(Č)
Price ( Č)
( Č cr )
FY17E
FY18E
FY17E
FY18E
FY17E
FY18E
FY17E
FY18E
FY17E
FY18E
FY17E
FY18E
FY17E
FY18E
6,577.0
6,907.0
Agri / Agri Chemical
Rallis
Neutral
261
-
5,078
1,937
2,164
13.3
14.3
9.0
11.0
29.0
23.7
5.1
4.4
18.4
19.8
2.7
2.3
United Phosphorus
Neutral
726
-
36,804
15,176
17,604
18.5
18.5
37.4
44.6
19.4
16.3
3.8
3.2
21.4
21.2
2.5
2.1
Auto & Auto Ancillary
Ashok Leyland
Buy
85
111
24,062
20,021
21,915
11.6
11.9
4.5
5.3
18.8
15.9
3.8
3.4
20.6
21.5
1.1
1.0
Bajaj Auto
Neutral
2,808
-
81,240
25,093
27,891
19.5
19.2
143.9
162.5
19.5
17.3
5.5
4.7
30.3
29.4
3.0
2.6
Bharat Forge
Neutral
1,041
-
24,232
7,726
8,713
20.5
21.2
35.3
42.7
29.5
24.4
5.4
4.9
18.9
20.1
3.2
2.8
Eicher Motors
Neutral
25,588
-
69,624
16,583
20,447
17.5
18.0
598.0
745.2
42.8
34.3
14.6
11.1
41.2
38.3
4.0
3.2
Gabriel India
Accumulate
122
130
1,747
1,544
1,715
9.0
9.3
5.4
6.3
22.5
19.3
4.3
3.8
18.9
19.5
1.1
1.0
Hero Motocorp
Accumulate
3,224
3,446
64,379
28,083
30,096
15.3
15.7
171.8
187.0
18.8
17.2
6.6
5.5
30.1
27.9
2.1
1.9
Jamna Auto Industries Neutral
213
-
1,694
1,486
1,620
9.8
9.9
15.0
17.2
14.2
12.4
3.1
2.6
21.8
21.3
1.2
1.1
L G Balakrishnan & Bros Neutral
621
-
975
1,302
1,432
11.6
11.9
43.7
53.0
14.2
11.7
2.0
1.8
13.8
14.2
0.8
0.8
Mahindra and Mahindra Neutral
1,285
-
79,792
46,534
53,077
11.6
11.7
67.3
78.1
19.1
16.5
3.1
2.7
15.4
15.8
1.7
1.4
Maruti
Accumulate
6,024
6,560
181,982
67,822
83,288
16.0
16.4
253.8
312.4
23.7
19.3
5.5
4.4
23.0
22.9
2.4
1.8
Minda Industries
Neutral
444
-
3,525
2,728
3,042
9.0
9.1
68.2
86.2
6.5
5.2
1.5
1.2
23.8
24.3
1.4
1.2
Motherson Sumi
Neutral
373
-
52,319
45,896
53,687
7.8
8.3
13.0
16.1
28.6
23.2
9.2
7.4
34.7
35.4
1.2
1.0
Rane Brake Lining
Neutral
1,030
-
815
511
562
11.3
11.5
28.1
30.9
36.7
33.3
5.6
5.1
15.3
15.0
1.7
1.6
Setco Automotive
Neutral
35
-
461
741
837
13.0
13.0
15.2
17.0
2.3
2.0
0.4
0.3
15.8
16.3
1.0
0.9
Tata Motors
Neutral
466
-
134,536
300,209
338,549
8.9
8.4
42.7
54.3
10.9
8.6
1.8
1.5
15.6
17.2
0.6
0.5
TVS Motor
Neutral
432
-
20,505
13,390
15,948
6.9
7.1
12.8
16.5
33.8
26.1
8.4
6.7
26.3
27.2
1.6
1.3
Amara Raja Batteries
Accumulate
889
1,009
15,185
5,305
6,100
16.0
16.3
28.4
34.0
31.3
26.2
6.0
5.1
19.3
19.3
2.9
2.5
Exide Industries
Neutral
224
-
19,036
7,439
8,307
15.0
15.0
8.1
9.3
27.7
24.1
3.9
3.5
14.3
16.7
2.2
1.9
Apollo Tyres
Accumulate
209
235
10,621
12,877
14,504
14.3
13.9
21.4
23.0
9.7
9.1
1.5
1.3
16.4
15.2
1.0
0.9
Ceat
Accumulate
1,324
1,450
5,356
7,524
8,624
13.0
12.7
131.1
144.3
10.1
9.2
1.9
1.6
19.8
18.6
0.8
0.7
JK Tyres
Neutral
131
-
2,980
7,455
8,056
15.0
15.0
21.8
24.5
6.0
5.4
1.3
1.0
22.8
21.3
0.5
0.4
Swaraj Engines
Neutral
1,484
-
1,842
660
810
15.2
16.4
54.5
72.8
27.2
20.4
8.5
7.7
31.5
39.2
2.6
2.1
Subros
Neutral
212
-
1,273
1,488
1,681
11.7
11.9
6.4
7.2
33.2
29.6
3.5
3.2
10.8
11.4
1.1
0.9
Indag Rubber
Neutral
203
-
534
286
326
19.8
16.8
11.7
13.3
17.4
15.3
2.9
2.7
17.8
17.1
1.5
1.3
Capital Goods
ACE
Neutral
60
-
592
709
814
4.1
4.6
1.4
2.1
42.8
28.5
1.8
1.7
4.4
6.0
1.0
0.9
Stock Watch
April 03, 2017
Company Name
Reco
CMP
Target
Mkt Cap
Sales ( Čcr )
OPM(%)
EPS (Č)
PER(x)
P/BV(x)
RoE(%)
EV/Sales(x)
(Č)
Price ( Č)
( Č cr )
FY17E
FY18E
FY17E
FY18E
FY17E
FY18E
FY17E
FY18E
FY17E
FY18E
FY17E
FY18E
FY17E
FY18E
Capital Goods
BEML
Neutral
1,361
-
5,667
3,451
4,055
6.3
9.2
31.4
57.9
43.3
23.5
2.6
2.4
6.3
10.9
1.8
1.5
Bharat Electronics
Neutral
157
-
35,012
8,137
9,169
16.8
17.2
58.7
62.5
2.7
2.5
0.4
0.4
44.6
46.3
3.3
2.9
Voltas
Neutral
412
-
13,637
6,511
7,514
7.9
8.7
12.9
16.3
32.0
25.3
5.8
5.0
16.7
18.5
1.8
1.6
BGR Energy
Neutral
138
-
997
16,567
33,848
6.0
5.6
7.8
5.9
17.7
23.4
1.0
1.0
4.7
4.2
0.2
0.1
BHEL
Neutral
163
-
39,920
28,797
34,742
-
2.8
2.3
6.9
70.9
23.6
1.2
1.2
1.3
4.8
1.0
0.8
Blue Star
Accumulate
693
740
6,621
4,283
5,077
5.9
7.3
14.9
22.1
46.5
31.3
9.0
7.6
20.4
26.4
1.6
1.3
CG Power and Industrial
Neutral
78
-
4,867
5,777
6,120
5.9
7.0
3.3
4.5
23.5
17.3
1.0
1.0
4.4
5.9
0.8
0.7
Solutions
Greaves Cotton
Neutral
175
-
4,265
1,755
1,881
16.8
16.9
7.8
8.5
22.4
20.6
4.5
4.2
20.6
20.9
2.1
1.9
Inox Wind
Neutral
170
-
3,783
5,605
6,267
15.7
16.4
24.8
30.0
6.9
5.7
1.9
1.4
25.9
24.4
0.7
0.6
KEC International
Neutral
208
-
5,345
9,294
10,186
7.9
8.1
9.9
11.9
21.0
17.5
3.1
2.7
15.6
16.3
0.8
0.7
KEI Industries
Accumulate
183
207
1,421
2,682
3,058
10.4
10.0
11.7
12.8
15.6
14.3
3.1
2.6
20.1
18.2
0.7
0.6
Thermax
Neutral
968
-
11,537
5,421
5,940
7.3
7.3
25.7
30.2
37.7
32.1
4.6
4.2
12.2
13.1
2.0
1.8
VATech Wabag
Neutral
681
-
3,718
3,136
3,845
8.9
9.1
26.0
35.9
26.2
19.0
3.3
2.8
13.4
15.9
1.1
0.9
Cement
ACC
Neutral
1,446
-
27,157
11,225
13,172
13.2
16.9
44.5
75.5
32.5
19.2
3.1
2.8
11.2
14.2
2.4
2.1
Ambuja Cements
Neutral
237
-
47,139
9,350
10,979
18.2
22.5
5.8
9.5
40.9
25.0
3.4
3.1
10.2
12.5
5.0
4.3
India Cements
Neutral
163
-
4,993
4,364
4,997
18.5
19.2
7.9
11.3
20.6
14.4
1.5
1.4
8.0
8.5
1.9
1.7
JK Cement
Neutral
935
-
6,538
4,398
5,173
15.5
17.5
31.2
55.5
30.0
16.9
3.6
3.1
12.0
15.5
2.0
1.7
J K Lakshmi Cement
Neutral
462
-
5,440
2,913
3,412
14.5
19.5
7.5
22.5
61.7
20.6
3.8
3.2
12.5
18.0
2.5
2.1
Orient Cement
Neutral
131
-
2,692
2,114
2,558
18.5
20.5
8.1
11.3
16.2
11.6
2.4
2.0
9.0
14.0
1.9
1.5
UltraTech Cement
Neutral
3,990
-
109,525
25,768
30,385
21.0
23.5
111.0
160.0
36.0
24.9
4.6
4.0
13.5
15.8
4.3
3.6
Construction
ITNL
Neutral
109
-
3,599
8,946
10,017
31.0
31.6
8.1
9.1
13.5
12.0
0.5
0.5
4.2
5.0
3.7
3.5
KNR Constructions
Neutral
194
-
2,721
1,385
1,673
14.7
14.0
41.2
48.5
4.7
4.0
0.9
0.8
14.9
15.2
2.0
1.7
Larsen & Toubro
Accumulate
1,578
1,700
147,185
111,017
124,908
11.0
11.0
61.1
66.7
25.8
23.6
3.1
2.9
13.1
12.9
2.4
2.2
Gujarat Pipavav Port
Neutral
165
-
7,967
705
788
52.2
51.7
5.0
5.6
33.0
29.4
3.3
2.9
11.2
11.2
11.0
9.3
Nagarjuna Const.
Neutral
82
-
4,548
8,842
9,775
9.1
8.8
5.3
6.4
15.4
12.8
1.2
1.1
8.2
9.1
0.7
0.6
PNC Infratech
Buy
118
143
3,018
2,350
2,904
13.1
13.2
9.0
8.8
13.1
13.4
0.5
0.4
15.9
13.9
1.4
1.1
Simplex Infra
Neutral
311
-
1,538
6,829
7,954
10.5
10.5
31.4
37.4
9.9
8.3
1.0
0.9
9.9
13.4
0.7
0.6
Power Mech Projects
Neutral
534
-
786
1,801
2,219
12.7
14.6
72.1
113.9
7.4
4.7
1.4
1.2
16.8
11.9
0.4
0.3
Sadbhav Engineering
Neutral
305
-
5,236
3,598
4,140
10.3
10.6
9.0
11.9
33.9
25.7
3.6
3.1
9.9
11.9
1.7
1.5
Stock Watch
April 03, 2017
Company Name
Reco
CMP
Target
Mkt Cap
Sales ( Čcr )
OPM(%)
EPS (Č)
PER(x)
P/BV(x)
RoE(%)
EV/Sales(x)
(Č)
Price ( Č)
( Č cr )
FY17E
FY18E
FY17E
FY18E
FY17E
FY18E
FY17E
FY18E
FY17E
FY18E
FY17E
FY18E
FY17E
FY18E
Construction
NBCC
Neutral
172
-
15,485
7,428
9,549
7.9
8.6
8.2
11.0
21.0
15.6
1.0
0.8
28.2
28.7
1.8
1.3
MEP Infra
Neutral
53
-
858
1,877
1,943
30.6
29.8
3.0
4.2
17.6
12.6
8.5
5.7
0.6
0.6
1.8
1.7
SIPL
Neutral
96
-
3,364
1,036
1,252
65.5
66.2
(8.4)
(5.6)
3.6
4.1
(22.8)
(15.9)
11.5
9.5
Engineers India
Neutral
144
-
9,700
1,725
1,935
16.0
19.1
11.4
13.9
12.6
10.4
1.7
1.7
13.4
15.3
4.6
4.1
Financials
Axis Bank
Buy
491
580
117,507
46,932
53,575
3.5
3.4
32.4
44.6
15.2
11.0
2.0
1.7
13.6
16.5
-
-
Bank of Baroda
Neutral
173
-
39,850
19,980
23,178
1.8
1.8
11.5
17.3
15.0
10.0
1.7
1.4
8.3
10.1
-
-
Canara Bank
Neutral
303
-
16,453
15,225
16,836
1.8
1.8
14.5
28.0
20.9
10.8
1.4
1.2
5.8
8.5
-
-
Can Fin Homes
Neutral
2,121
-
5,647
420
526
3.5
3.5
86.5
107.8
24.5
19.7
5.3
4.3
23.6
24.1
-
-
Cholamandalam Inv. &
Buy
965
1,230
15,082
2,012
2,317
6.3
6.3
42.7
53.6
22.6
18.0
3.6
3.1
16.9
18.3
-
-
Fin. Co.
Dewan Housing Finance Neutral
367
-
11,497
2,225
2,688
2.9
2.9
29.7
34.6
12.4
10.6
2.0
1.7
16.1
16.8
-
-
Equitas Holdings
Buy
170
235
5,724
939
1,281
11.7
11.5
5.8
8.2
29.2
20.7
2.5
2.2
10.9
11.5
-
-
Federal Bank
Neutral
91
-
15,740
8,259
8,995
3.0
3.0
4.3
5.6
21.2
16.3
1.8
1.7
8.5
10.1
-
-
HDFC
Neutral
1,502
-
238,626
11,475
13,450
3.4
3.4
45.3
52.5
33.2
28.6
6.4
5.7
20.2
20.5
-
-
HDFC Bank
Neutral
1,442
-
369,596
46,097
55,433
4.5
4.5
58.4
68.0
24.7
21.2
4.3
3.6
18.8
18.6
-
-
ICICI Bank
Accumulate
277
315
161,395
42,800
44,686
3.1
3.3
18.0
21.9
15.4
12.7
2.1
1.9
11.1
12.3
-
-
Lakshmi Vilas Bank
Neutral
166
-
3,186
3,339
3,799
2.7
2.8
11.0
14.0
15.1
11.9
1.6
1.4
11.2
12.7
-
-
LIC Housing Finance
Neutral
616
-
31,070
3,712
4,293
2.6
2.5
39.0
46.0
15.8
13.4
3.0
2.5
19.9
20.1
-
-
Punjab Natl.Bank
Neutral
151
-
32,068
23,532
23,595
2.3
2.4
6.8
12.6
22.2
12.0
3.4
2.4
3.3
6.5
-
-
RBL Bank
Neutral
495
-
18,289
1,783
2,309
2.6
2.6
12.7
16.4
38.9
30.2
4.3
3.8
12.8
13.3
-
-
Repco Home Finance
Buy
702
825
4,390
388
457
4.5
4.2
30.0
38.0
23.4
18.5
3.9
3.3
18.0
19.2
-
-
South Ind.Bank
Neutral
21
-
2,894
6,435
7,578
2.5
2.5
2.7
3.1
7.9
6.9
1.0
0.9
10.1
11.2
-
-
St Bk of India
Neutral
293
-
233,305
88,650
98,335
2.6
2.6
13.5
18.8
21.7
15.6
2.1
1.8
7.0
8.5
-
-
Union Bank
Neutral
156
-
10,721
13,450
14,925
2.3
2.3
25.5
34.5
6.1
4.5
0.9
0.8
7.5
10.2
-
-
Yes Bank
Neutral
1,549
-
65,647
8,978
11,281
3.3
3.4
74.0
90.0
20.9
17.2
4.0
3.4
17.0
17.2
-
-
FMCG
Akzo Nobel India
Neutral
1,912
-
9,170
2,955
3,309
13.3
13.7
57.2
69.3
33.5
27.6
10.9
9.2
32.7
33.3
2.9
2.6
Asian Paints
Neutral
1,071
-
102,749
17,128
18,978
16.8
16.4
19.1
20.7
56.1
51.8
19.5
18.4
34.8
35.5
5.9
5.3
Britannia
Accumulate
3,383
3,626
40,595
9,594
11,011
14.6
14.9
80.3
94.0
42.1
36.0
17.3
13.4
41.2
-
4.1
3.5
Colgate
Neutral
998
-
27,154
4,605
5,149
23.4
23.4
23.8
26.9
42.0
37.1
23.2
18.2
64.8
66.8
5.8
5.2
Dabur India
Accumulate
277
304
48,821
8,315
9,405
19.8
20.7
8.1
9.2
34.2
30.1
9.5
7.9
31.6
31.0
5.5
4.9
Stock Watch
April 03, 2017
Company Name
Reco
CMP
Target
Mkt Cap
Sales ( Čcr )
OPM(%)
EPS (Č)
PER(x)
P/BV(x)
RoE(%)
EV/Sales(x)
(Č)
Price ( Č)
( Č cr )
FY17E FY18E
FY17E
FY18E
FY17E
FY18E
FY17E
FY18E
FY17E
FY18E
FY17E
FY18E
FY17E
FY18E
FMCG
GlaxoSmith Con*
Neutral
5,160
-
21,700
4,350
4,823
21.2
21.4
179.2
196.5
28.8
26.3
7.7
6.5
27.1
26.8
4.4
3.9
Godrej Consumer
Neutral
1,670
-
56,880
10,235
11,428
18.4
18.6
41.1
44.2
40.6
37.8
9.0
7.6
24.9
24.8
5.6
5.0
HUL
Neutral
910
-
196,902
35,252
38,495
17.8
17.8
20.7
22.4
44.1
40.6
42.1
36.1
95.6
88.9
5.4
5.0
ITC
Neutral
280
-
340,673
40,059
44,439
38.3
39.2
9.0
10.1
31.2
27.7
8.7
7.6
27.8
27.5
8.0
7.2
Marico
Neutral
294
-
37,982
6,430
7,349
18.8
19.5
6.4
7.7
46.0
38.2
13.9
11.7
33.2
32.5
5.7
5.0
Nestle*
Neutral
6,681
-
64,417
10,073
11,807
20.7
21.5
124.8
154.2
53.5
43.3
22.0
19.8
34.8
36.7
6.2
5.3
Tata Global
Neutral
151
-
9,502
8,675
9,088
9.8
9.8
7.4
8.2
20.3
18.4
1.6
1.5
7.9
8.1
1.0
1.0
Procter & Gamble
Neutral
7,592
-
24,645
2,939
3,342
23.2
23.0
146.2
163.7
51.9
46.4
13.2
10.9
25.3
23.5
7.9
6.9
Hygiene
IT
HCL Tech^
Accumulate
873
1,000
123,207
49,242
57,168
20.5
20.5
55.7
64.1
15.7
13.6
3.2
2.4
20.3
17.9
2.4
1.9
Infosys
Buy
1,021
1,249
234,472
68,350
77,326
27.0
27.0
62.5
69.4
16.3
14.7
3.5
3.2
21.3
21.6
2.9
2.5
TCS
Accumulate
2,431
2,700
479,031
119,025
133,308
27.6
27.6
131.2
145.5
18.5
16.7
6.0
5.5
32.4
33.1
3.8
3.4
Tech Mahindra
Buy
460
600
44,769
29,673
32,937
15.5
17.0
32.8
39.9
14.0
11.5
2.8
2.4
19.6
20.7
1.3
1.1
Wipro
Accumulate
515
583
125,276
55,440
60,430
18.1
18.1
36.1
38.9
14.3
13.3
2.6
2.4
19.0
17.6
2.0
1.8
Media
D B Corp
Neutral
379
-
6,977
2,297
2,590
27.4
28.2
21.0
23.4
18.1
16.2
4.2
3.7
23.7
23.1
2.8
2.4
HT Media
Neutral
83
-
1,927
2,693
2,991
12.6
12.9
7.9
9.0
10.5
9.2
0.9
0.8
7.8
8.3
0.3
0.2
Jagran Prakashan
Buy
191
225
6,247
2,355
2,635
28.0
28.0
10.8
12.5
17.7
15.3
3.8
3.3
21.7
21.7
2.7
2.3
Sun TV Network
Neutral
800
-
31,507
2,850
3,265
70.1
71.0
26.2
30.4
30.5
26.3
7.8
6.9
24.3
25.6
10.7
9.2
Hindustan Media
Neutral
284
-
2,083
1,016
1,138
24.3
25.2
27.3
30.1
10.4
9.4
2.0
1.8
16.2
15.8
1.4
1.2
Ventures
TV Today Network
Buy
258
344
1,538
567
645
26.7
27.0
15.4
18.1
16.8
14.3
2.5
2.2
14.9
15.2
2.3
1.9
Metals & Mining
Coal India
Neutral
293
-
181,753
84,638
94,297
21.4
22.3
24.5
27.1
12.0
10.8
5.0
4.7
42.6
46.0
1.7
1.5
Hind. Zinc
Neutral
289
-
122,048
14,252
18,465
55.9
48.3
15.8
21.5
18.3
13.4
3.0
2.6
17.0
20.7
8.6
6.6
Hindalco
Neutral
195
-
40,315
107,899
112,095
7.4
8.2
9.2
13.0
21.2
15.0
1.0
1.0
4.8
6.6
0.9
0.8
JSW Steel
Neutral
188
-
45,347
53,201
58,779
16.1
16.2
130.6
153.7
1.4
1.2
0.2
0.2
14.0
14.4
1.6
1.4
NMDC
Neutral
133
-
42,111
6,643
7,284
44.4
47.7
7.1
7.7
18.8
17.3
1.6
1.6
8.8
9.2
4.1
3.7
SAIL
Neutral
61
-
25,276
47,528
53,738
(0.7)
2.1
(1.9)
2.6
23.5
0.7
0.6
(1.6)
3.9
1.4
1.3
Vedanta
Neutral
275
-
81,514
71,744
81,944
19.2
21.7
13.4
20.1
20.5
13.7
1.8
1.6
8.4
11.3
1.5
1.2
Tata Steel
Neutral
483
-
46,876
121,374
121,856
7.2
8.4
18.6
34.3
26.0
14.1
1.6
1.5
6.1
10.1
1.0
1.0
Oil & Gas
Cairn India
Neutral
305
-
57,280
9,127
10,632
4.3
20.6
8.8
11.7
34.7
26.1
1.1
1.1
3.3
4.2
7.7
6.5
GAIL
Neutral
376
-
63,669
56,220
65,198
9.3
10.1
27.1
33.3
13.9
11.3
1.3
1.2
9.3
10.7
1.3
1.1
Stock Watch
April 03, 2017
Company Name
Reco
CMP
Target
Mkt Cap
Sales ( Čcr )
OPM(%)
EPS (Č)
PER(x)
P/BV(x)
RoE(%)
EV/Sales(x)
(Č)
Price ( Č)
( Č cr )
FY17E FY18E
FY17E
FY18E
FY17E
FY18E
FY17E
FY18E
FY17E
FY18E
FY17E
FY18E
FY17E
FY18E
Oil & Gas
ONGC
Neutral
185
-
237,479
137,222
152,563
15.0
21.8
19.5
24.1
9.5
7.7
0.8
0.8
8.5
10.1
2.0
1.8
Indian Oil Corp
Neutral
387
-
187,948
373,359
428,656
5.9
5.5
54.0
59.3
7.2
6.5
1.1
1.0
16.0
15.6
0.7
0.6
Reliance Industries
Neutral
1,319
-
428,908
301,963
358,039
12.1
12.6
87.7
101.7
15.0
13.0
1.5
1.4
10.7
11.3
1.9
1.6
Pharmaceuticals
Alembic Pharma
Accumulate
624
689
11,757
3,483
4,244
20.2
21.4
24.3
33.6
25.7
18.6
5.8
4.7
25.5
25.3
3.3
2.6
Alkem Laboratories Ltd
Neutral
2,205
-
26,363
6,065
7,009
18.7
20.0
80.2
92.0
27.5
24.0
6.2
5.2
22.5
21.6
4.3
3.7
Aurobindo Pharma
Buy
675
877
39,555
15,720
18,078
23.7
23.7
41.4
47.3
16.3
14.3
4.2
3.3
29.6
26.1
2.7
2.4
Aventis*
Neutral
4,715
-
10,860
2,277
2,597
16.6
17.4
128.9
157.0
36.6
30.0
6.3
4.8
21.6
26.4
4.5
3.8
Cadila Healthcare
Neutral
443
-
45,377
10,429
12,318
17.7
21.6
13.1
19.2
33.8
23.1
7.1
5.6
22.8
27.1
4.4
3.6
Cipla
Sell
592
465
47,651
15,378
18,089
15.7
16.8
19.3
24.5
30.7
24.2
3.6
3.2
12.3
13.9
3.3
2.7
Dr Reddy's
Neutral
2,633
-
43,614
16,043
18,119
18.0
23.0
78.6
130.9
33.5
20.1
3.3
2.9
10.1
15.2
2.5
2.4
Dishman Pharma
Sell
290
143
4,680
1,718
1,890
22.7
22.8
9.5
11.3
30.5
25.7
3.0
2.7
10.1
10.9
3.2
2.8
GSK Pharma*
Neutral
2,735
-
23,168
2,800
3,290
10.2
20.6
32.2
60.3
84.9
45.4
15.7
15.5
17.2
34.5
8.0
6.9
Indoco Remedies
Neutral
250
-
2,303
1,112
1,289
16.2
18.2
11.6
16.0
21.6
15.6
3.4
2.9
17.0
20.1
2.2
1.8
Ipca labs
Neutral
623
-
7,865
3,258
3,747
12.8
15.3
12.1
19.2
51.5
32.5
3.2
2.9
6.4
9.5
2.5
2.2
Lupin
Buy
1,445
1,809
65,244
15,912
18,644
26.4
26.7
58.1
69.3
24.9
20.9
4.8
4.0
21.4
20.9
4.2
3.4
Sun Pharma
Buy
688
847
164,995
31,129
35,258
32.0
32.9
30.2
35.3
22.8
19.5
3.7
3.1
20.0
20.1
4.9
4.1
Power
Tata Power
Neutral
90
-
24,438
36,916
39,557
17.4
27.1
5.1
6.3
17.7
14.3
1.6
1.4
9.0
10.3
1.7
1.5
NTPC
Neutral
166
-
136,833
86,605
95,545
17.5
20.8
11.8
13.4
14.1
12.4
1.4
1.3
10.5
11.1
2.9
2.9
Power Grid
Accumulate
197
223
103,167
25,315
29,193
88.2
88.7
14.2
17.2
13.9
11.5
2.1
1.9
15.2
16.1
8.7
7.8
Real Estate
Prestige Estate
Neutral
217
-
8,123
4,707
5,105
25.2
26.0
10.3
13.0
21.0
16.7
1.7
1.6
10.3
10.2
2.9
2.6
MLIFE
Buy
387
522
1,589
1,152
1,300
22.7
24.6
29.9
35.8
12.9
10.8
1.0
0.9
7.6
8.6
2.1
1.7
Telecom
Bharti Airtel
Neutral
350
-
139,889
105,086
114,808
34.5
34.7
12.2
16.4
28.7
21.3
1.9
1.8
6.8
8.4
2.2
2.0
Idea Cellular
Neutral
86
-
30,898
40,133
43,731
37.2
37.1
6.4
6.5
13.4
13.2
1.1
1.0
8.2
7.6
1.8
1.5
zOthers
Abbott India
Neutral
4,639
-
9,857
3,153
3,583
14.1
14.4
152.2
182.7
30.5
25.4
149.6
127.8
25.6
26.1
2.8
2.4
Asian Granito
Accumulate
368
390
1,108
1,060
1,169
12.2
12.5
12.7
15.9
29.1
23.2
2.8
2.5
9.5
10.7
1.3
1.2
Bajaj Electricals
Accumulate
313
330
3,168
4,801
5,351
5.7
6.2
10.4
13.7
30.0
22.9
3.7
3.3
12.4
14.5
0.7
0.6
Banco Products (India)
Neutral
223
-
1,594
1,353
1,471
12.3
12.4
14.5
16.3
15.4
13.7
21.2
19.1
14.5
14.6
1.1
120.2
Coffee Day Enterprises
Neutral
232
-
4,787
2,964
3,260
20.5
21.2
4.7
8.0
-
29.0
2.7
2.5
5.5
8.5
2.0
1.8
Ltd
Competent Automobiles Neutral
180
-
111
1,137
1,256
3.1
2.7
28.0
23.6
6.4
7.6
34.6
31.3
14.3
11.5
0.1
0.1
Stock Watch
April 03, 2017
Company Name
Reco
CMP
Target
Mkt Cap
Sales ( Čcr )
OPM(%)
EPS (Č)
PER(x)
P/BV(x)
RoE(%)
EV/Sales(x)
(Č)
Price ( Č)
( Č cr )
FY17E
FY18E
FY17E
FY18E
FY17E
FY18E
FY17E
FY18E
FY17E
FY18E
FY17E
FY18E
FY17E
FY18E
zOthers
Elecon Engineering
Neutral
53
-
592
1,482
1,660
13.7
14.5
3.9
5.8
13.5
9.1
3.2
2.9
7.8
10.9
0.7
0.6
Finolex Cables
Neutral
517
-
7,901
2,883
3,115
12.0
12.1
14.2
18.6
36.4
27.8
19.4
16.9
15.8
14.6
2.4
2.2
Garware Wall Ropes
Neutral
710
-
1,553
863
928
15.1
15.2
36.4
39.4
19.5
18.0
3.5
3.0
17.5
15.9
1.7
1.6
Goodyear India*
Neutral
845
-
1,949
1,598
1,704
10.4
10.2
49.4
52.6
17.1
16.1
79.0
69.3
18.2
17.0
0.9
128.5
Hitachi
Neutral
1,811
-
4,925
2,081
2,433
8.8
8.9
33.4
39.9
54.2
45.4
43.8
36.5
22.1
21.4
2.4
2.0
HSIL
Neutral
350
-
2,534
2,384
2,515
15.8
16.3
15.3
19.4
22.9
18.1
22.8
19.6
7.8
9.3
1.2
1.1
Interglobe Aviation
Neutral
1,051
-
38,005
21,122
26,005
14.5
27.6
110.7
132.1
9.5
8.0
56.8
40.6
168.5
201.1
1.8
1.4
Jyothy Laboratories
Neutral
357
-
6,492
1,440
2,052
11.5
13.0
8.5
10.0
42.0
35.7
10.2
9.4
18.6
19.3
4.8
3.3
Kirloskar Engines India
Neutral
388
-
5,617
2,554
2,800
9.9
10.0
10.5
12.1
37.0
32.1
15.5
14.6
10.7
11.7
1.8
1.6
Ltd
Linc Pen & Plastics
Neutral
292
-
432
382
420
9.3
9.5
13.5
15.7
21.7
18.6
3.7
3.2
17.1
17.3
1.2
1.1
M M Forgings
Neutral
540
-
652
546
608
20.4
20.7
41.3
48.7
13.1
11.1
74.0
65.5
16.6
17.0
1.0
0.9
Manpasand Bever.
Neutral
705
-
4,031
836
1,087
19.6
19.4
16.9
23.8
41.7
29.6
5.0
4.4
12.0
14.8
4.6
3.4
Mirza International
Buy
86
107
1,035
963
1,069
17.2
18.0
6.1
7.5
14.0
11.5
2.1
1.8
15.0
15.7
1.3
1.1
MT Educare
Neutral
84
-
336
366
417
17.7
18.2
9.4
10.8
9.0
7.8
2.0
1.7
22.2
22.3
0.8
0.7
Narayana Hrudaya
Neutral
314
-
6,414
1,873
2,166
11.5
11.7
2.6
4.0
118.7
79.2
7.3
6.6
6.1
8.3
3.5
3.0
Navkar Corporation
Buy
177
265
2,519
369
561
42.9
42.3
6.9
11.5
25.6
15.3
1.8
1.6
7.4
10.5
7.8
5.2
Navneet Education
Neutral
162
-
3,794
1,062
1,147
24.0
24.0
6.1
6.6
26.7
24.5
5.5
4.9
20.6
19.8
3.7
3.4
Nilkamal
Neutral
1,952
-
2,913
1,995
2,165
10.7
10.4
69.8
80.6
28.0
24.2
111.5
96.9
16.6
16.5
1.5
1.3
Page Industries
Neutral
14,640
-
16,329
2,450
3,124
20.1
17.6
299.0
310.0
49.0
47.2
326.1
248.9
47.1
87.5
6.7
5.3
Parag Milk Foods
Neutral
228
-
1,918
1,919
2,231
9.3
9.6
9.5
12.9
24.1
17.6
3.8
3.1
15.5
17.5
1.2
1.0
Quick Heal
Neutral
236
-
1,657
408
495
27.3
27.0
7.7
8.8
30.5
26.9
2.8
2.8
9.3
10.6
3.2
2.7
Radico Khaitan
Accumulate
138
147
1,833
1,667
1,824
13.0
13.2
6.7
8.2
20.7
16.8
1.9
1.7
9.0
10.2
1.5
1.3
Relaxo Footwears
Neutral
497
-
5,969
2,085
2,469
9.2
8.2
7.6
8.0
65.7
62.5
25.5
21.8
17.9
18.8
3.0
2.5
S H Kelkar & Co.
Neutral
296
-
4,287
1,036
1,160
15.1
15.0
6.1
7.2
48.6
41.3
5.2
4.8
10.7
11.5
4.0
3.5
Siyaram Silk Mills
Accumulate
1,698
1,872
1,592
1,652
1,857
11.6
11.7
92.4
110.1
18.4
15.4
2.7
2.3
14.7
15.2
1.2
1.0
Styrolution ABS India*
Neutral
687
-
1,208
1,440
1,537
9.2
9.0
40.6
42.6
16.9
16.1
43.2
39.3
12.3
11.6
0.8
0.7
Surya Roshni
Neutral
213
-
932
3,342
3,625
7.8
7.5
17.3
19.8
12.3
10.8
23.4
18.8
10.5
10.8
0.5
0.5
Team Lease Serv.
Neutral
972
-
1,662
3,229
4,001
1.5
1.8
22.8
32.8
42.7
29.6
4.6
4.0
10.7
13.4
0.4
0.3
The Byke Hospitality
Neutral
185
-
742
287
384
20.5
20.5
7.6
10.7
24.3
17.3
5.1
4.1
20.7
23.5
2.6
1.9
Stock Watch
April 03, 2017
Company Name
Reco
CMP
Target Mkt Cap
Sales ( Čcr )
OPM(%)
EPS (Č)
PER(x)
P/BV(x)
RoE(%)
EV/Sales(x)
(Č)
Price ( Č)
( Č cr )
FY17E FY18E FY17E FY18E FY17E FY18E FY17E FY18E FY17E FY18E FY17E FY18E FY17E FY18E
zOthers
Transport Corporation of
Neutral
233
-
1,788
2,671
2,911
8.5
8.8
13.9
15.7
16.9
14.9
2.3
2.1
13.7
13.8
0.8
0.7
India
TVS Srichakra
Neutral
3,490
-
2,672
2,304
2,614
13.7
13.8
231.1
266.6
15.1
13.1
392.2
308.8
33.9
29.3
1.2
1.0
UFO Moviez
Neutral
428
-
1,180
619
685
33.2
33.4
30.0
34.9
14.3
12.3
2.0
1.7
13.8
13.9
1.6
1.3
Visaka Industries
Neutral
271
-
430
1,051
1,138
10.3
10.4
21.0
23.1
12.9
11.7
34.7
32.5
9.0
9.2
0.7
0.6
VRL Logistics
Neutral
312
-
2,849
1,902
2,119
16.7
16.6
14.6
16.8
21.4
18.6
4.7
4.1
21.9
22.2
1.6
1.4
VIP Industries
Neutral
198
-
2,797
1,270
1,450
10.4
10.4
5.6
6.5
35.3
30.5
7.3
6.4
20.7
21.1
2.2
1.9
Navin Fluorine
Buy
3,043
3,650
2,980
789
945
21.1
22.4
120.1
143.4
25.3
21.2
4.1
3.5
17.8
18.5
3.7
3.0
Source: Company, Angel Research; Note: *December year end; #September year end; &October year end; Price as on March 31, 2017
Market Outlook
April 03, 2017
Research Team Tel: 022 - 39357800
DISCLAIMER
Angel Broking Private Limited (hereinafter referred to as “Angel”) is a registered Member of National Stock Exchange of India
Limited,Bombay Stock Exchange Limited and Metropolitan Stock Exchange Limited. It is also registered as a Depository Participant with
CDSL and Portfolio Manager with SEBI. It also has registration with AMFI as a Mutual Fund Distributor. Angel Broking Private Limited is a
registered entity with SEBI for Research Analyst in terms of SEBI (Research Analyst) Regulations, 2014 vide registration number
INH000000164. Angel or its associates has not been debarred/ suspended by SEBI or any other regulatory authority for accessing
/dealing in securities Market. Angel or its associates/analyst has not received any compensation / managed or
co-managed public offering of securities of the company covered by Analyst during the past twelve months.
This document is solely for the personal information of the recipient, and must not be singularly used as the basis of any investment
decision. Nothing in this document should be construed as investment or financial advice. Each recipient of this document should make
such investigations as they deem necessary to arrive at an independent evaluation of an investment in the securities of the companies
referred to in this document (including the merits and risks involved), and should consult their own advisors to determine the merits and
risks of such an investment.
Reports based on technical and derivative analysis center on studying charts of a stock's price movement, outstanding positions and
trading volume, as opposed to focusing on a company's fundamentals and, as such, may not match with a report on a company's
fundamentals. Investors are advised to refer the Fundamental and Technical Research Reports available on our website to evaluate the
contrary view, if any.
The information in this document has been printed on the basis of publicly available information, internal data and other reliable
sources believed to be true, but we do not represent that it is accurate or complete and it should not be relied on as such, as this
document is for general guidance only. Angel Broking Pvt. Limited or any of its affiliates/ group companies shall not be in any way
responsible for any loss or damage that may arise to any person from any inadvertent error in the information contained in this report.
Angel Broking Pvt. Limited has not independently verified all the information contained within this document. Accordingly, we cannot
testify, nor make any representation or warranty, express or implied, to the accuracy, contents or data contained within this document.
While Angel Broking Pvt. Limited endeavors to update on a reasonable basis the information discussed in this material, there may be
regulatory, compliance, or other reasons that prevent us from doing so.
This document is being supplied to you solely for your information, and its contents, information or data may not be reproduced,
redistributed or passed on, directly or indirectly.
Neither Angel Broking Pvt. Limited, nor its directors, employees or affiliates shall be liable for any loss or damage that may arise from
or in connection with the use of this information.